We scored 1.5 million shopping visits for a national apparel retailer, threw away everyone who bought on the spot, and waited a full week to see which of the rest came back. Three findings. The last one changes how you pace your spend.
Key takeaways
Out-of-session conversion is a purchase made after the shopper has already left your site. They browsed, they closed the tab, and some time in the following days they came back and bought.
The distinction matters more than it sounds. When someone buys during the visit you are watching, that is not a prediction. It is an observation. The sale is already banked, the customer is already yours, and a model that reports it afterwards has told you nothing you can act on.
The opportunity is the other group. The overwhelming majority of people who land on an ecommerce site leave without buying. Most are gone. A small, valuable minority return within the week and purchase. That is the moveable middle, and it is the only group where a prediction can still change the outcome, because they are the only people you still have a chance to influence.
Everything here is about prospects. Every visitor in this study was new to the brand, with no prior purchase behind them. Nobody is being reactivated off a CRM list. This is the top of the funnel, where the prospecting budget goes and where platform AI has the least to work with.
Prospecting asks the auction to find two kinds of people. The ones who will buy in the session, and the moveable middle who will buy days later. Both are worth paying for. Only one of them is reliably visible to the platform.
In-session buyers are already covered. The purchase fires while the shopper is still on the page, same device, same session. Meta, Google and TikTok see it, attribute it, and train on it. That group needs no help from you.
Out-of-session buyers are the ones signal loss takes away. The order lands on Thursday morning, and the visit that caused it ended on Tuesday night, often on another device and usually past the window that would have joined the two. What the platform records is a visit that did not convert, so it trains against the very people who were about to come back.
That gap is the reason to model this at all. A fifth of the people who walk away carry two thirds of the orders. Train the auction only on what the platform can see for itself and you bid hardest for the customers you have already won, and cheapest for the ones still in play.
We scored every visit to a national apparel retailer's site live, every five minutes increments, for nine days. Anyone who purchased during the visit was removed from the analysis entirely. We then waited a full seven days after each visit so no purchase could still be in flight, and matched the orders back to the visit that preceded them.
What remains is 1.5 million scored visits and roughly 70,800 purchases that happened after the shopper had already left. Three findings came out of it.
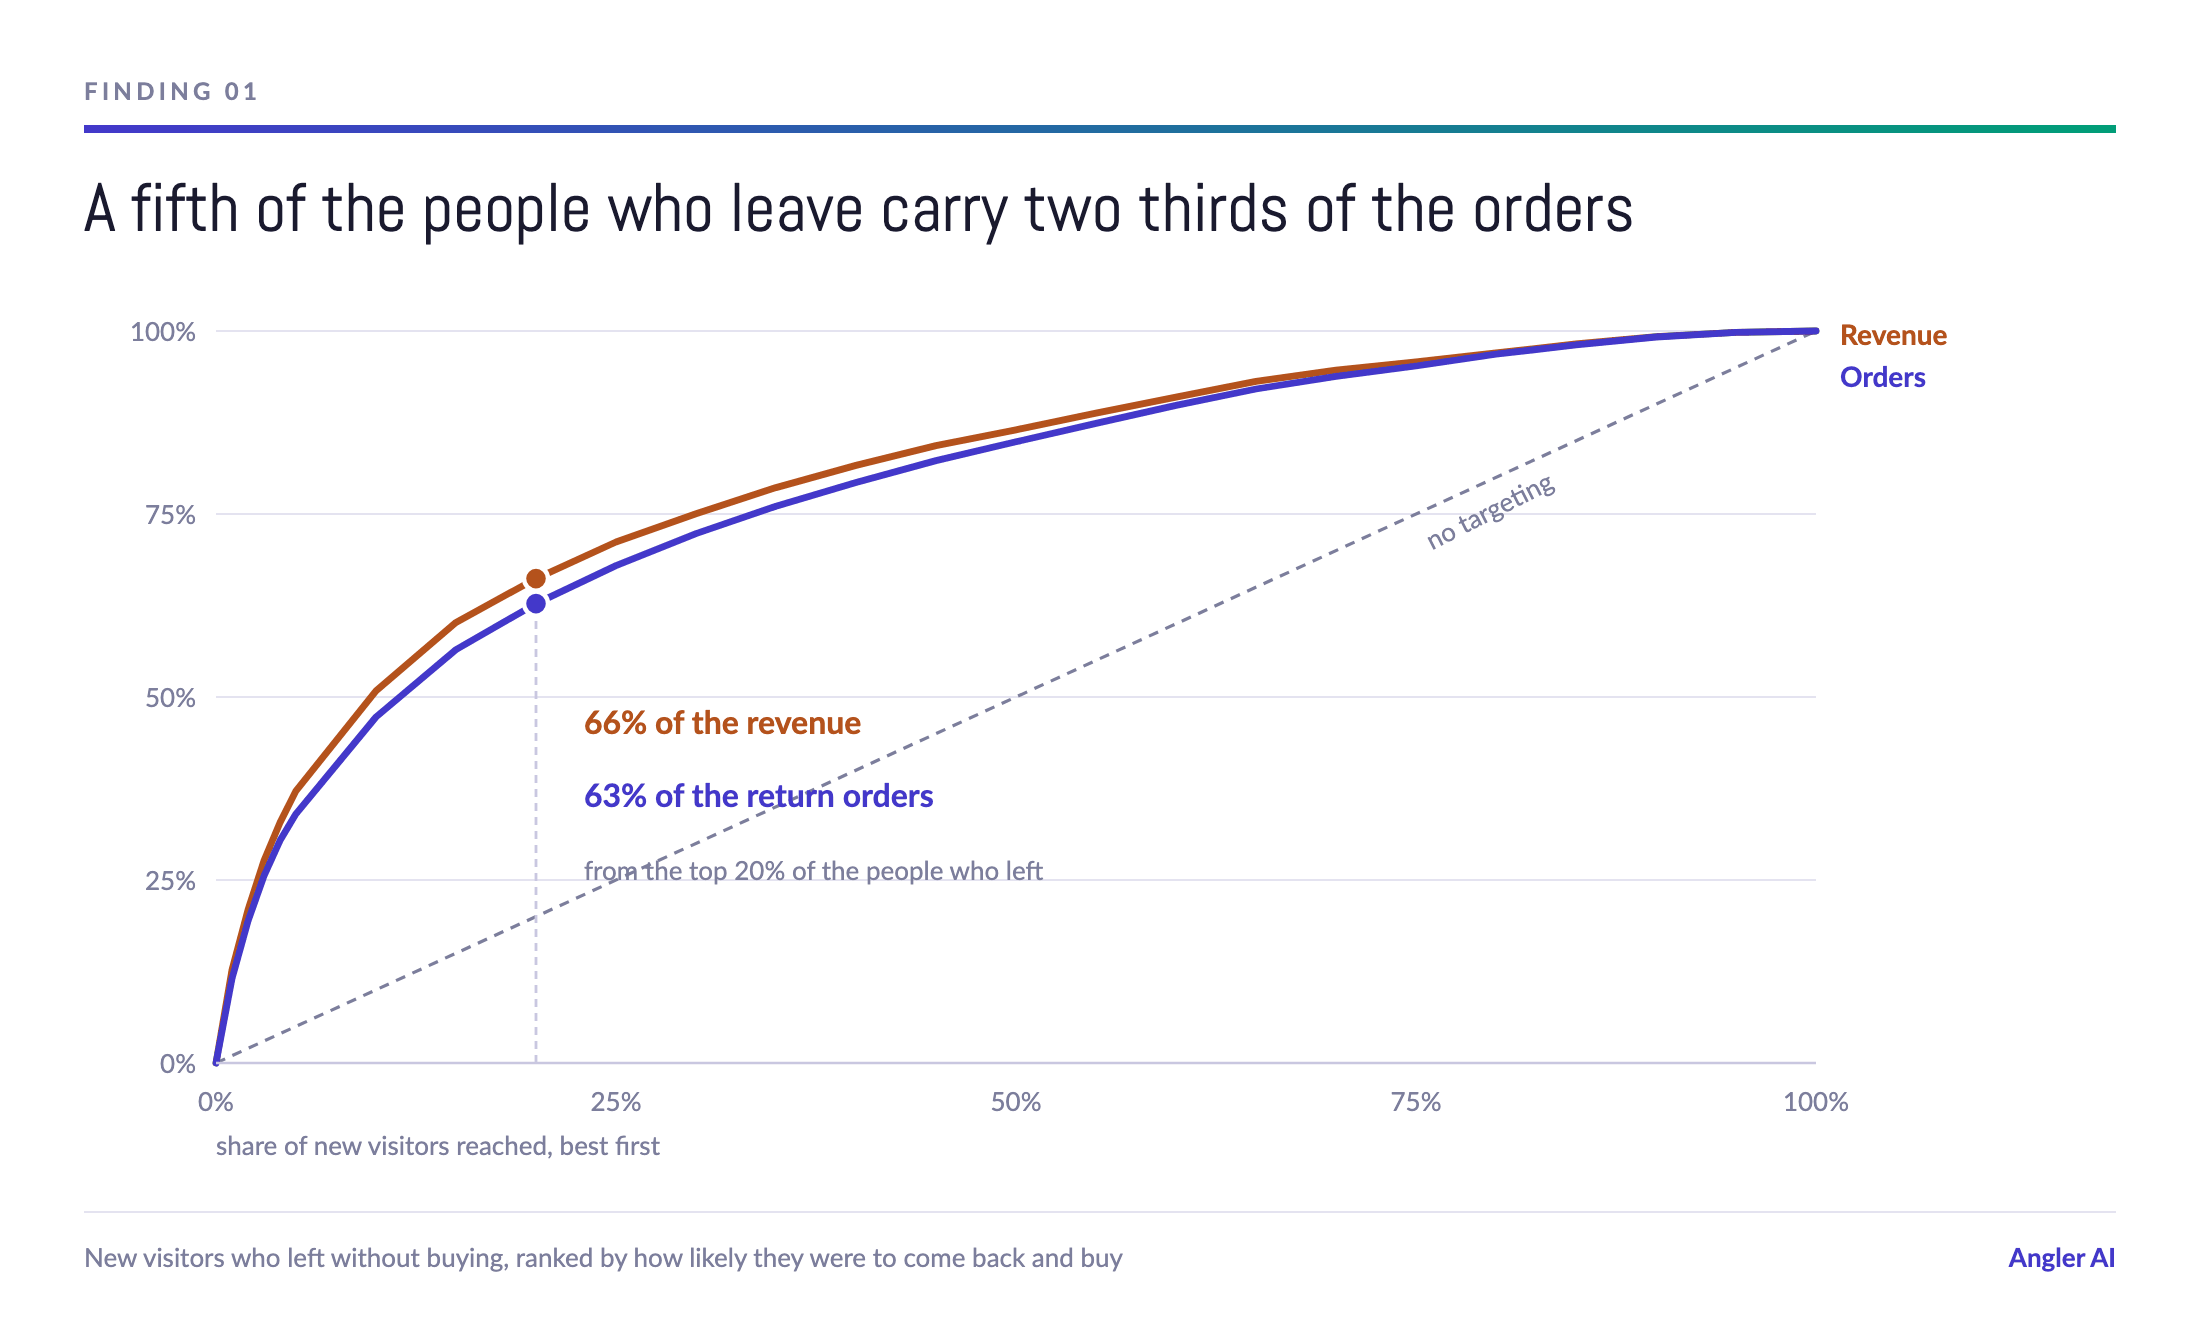
Ranked by how likely they were to return and buy, the top 5 percent of departed new visitors bought at 12.1 percent. The segment average was 1.8 percent. The bottom half came in at 0.5 percent. Same traffic, same site, same week, and a spread of more than 20 to 1 in what happens next.
Read cumulatively, the top 20 percent carried 63 percent of the eventual orders and 66 percent of the revenue. Extending to 30 percent picks up another 10 points of orders. Past halfway, each further slice returns under 3 points. The efficient range for a prospecting audience sits between a fifth and a third of the people who walked away.
One detail worth pulling out: revenue coverage runs ahead of order coverage at every cutoff. The people most likely to come back also come back with bigger baskets, so a revenue weighted bidding objective captures more of this than a volume weighted one.

Plot when visits end and when the eventual purchases happen, both in the shopper's own local time, and the two curves do not line up.
Browsing peaks in the evening, between 8 and 9pm. Buying peaks at 7am. For new visitors the window from 6am to 1pm holds 36 percent of visit endings but 42 percent of the purchases that follow. From 5pm to midnight it is 38 percent of visit endings and only 32 percent of purchases. The single biggest hour for coming back is 7am, taking 9 percent of purchases off 6 percent of visits.
The evening is when people shop. The next morning is when they pay.
A caution, because this is easy to get wrong. Measure the gap in elapsed hours and you see a spike, a dip, then a climb, which looks like shoppers sleeping on a decision. They are not. Six to nine hours after a 9pm visit is 3 to 6am, when nobody is buying anything at all. The dip is the clock, not the customer. The pattern only appears when you read real time of day, in the shopper's own timezone.
This is the one we did not expect.
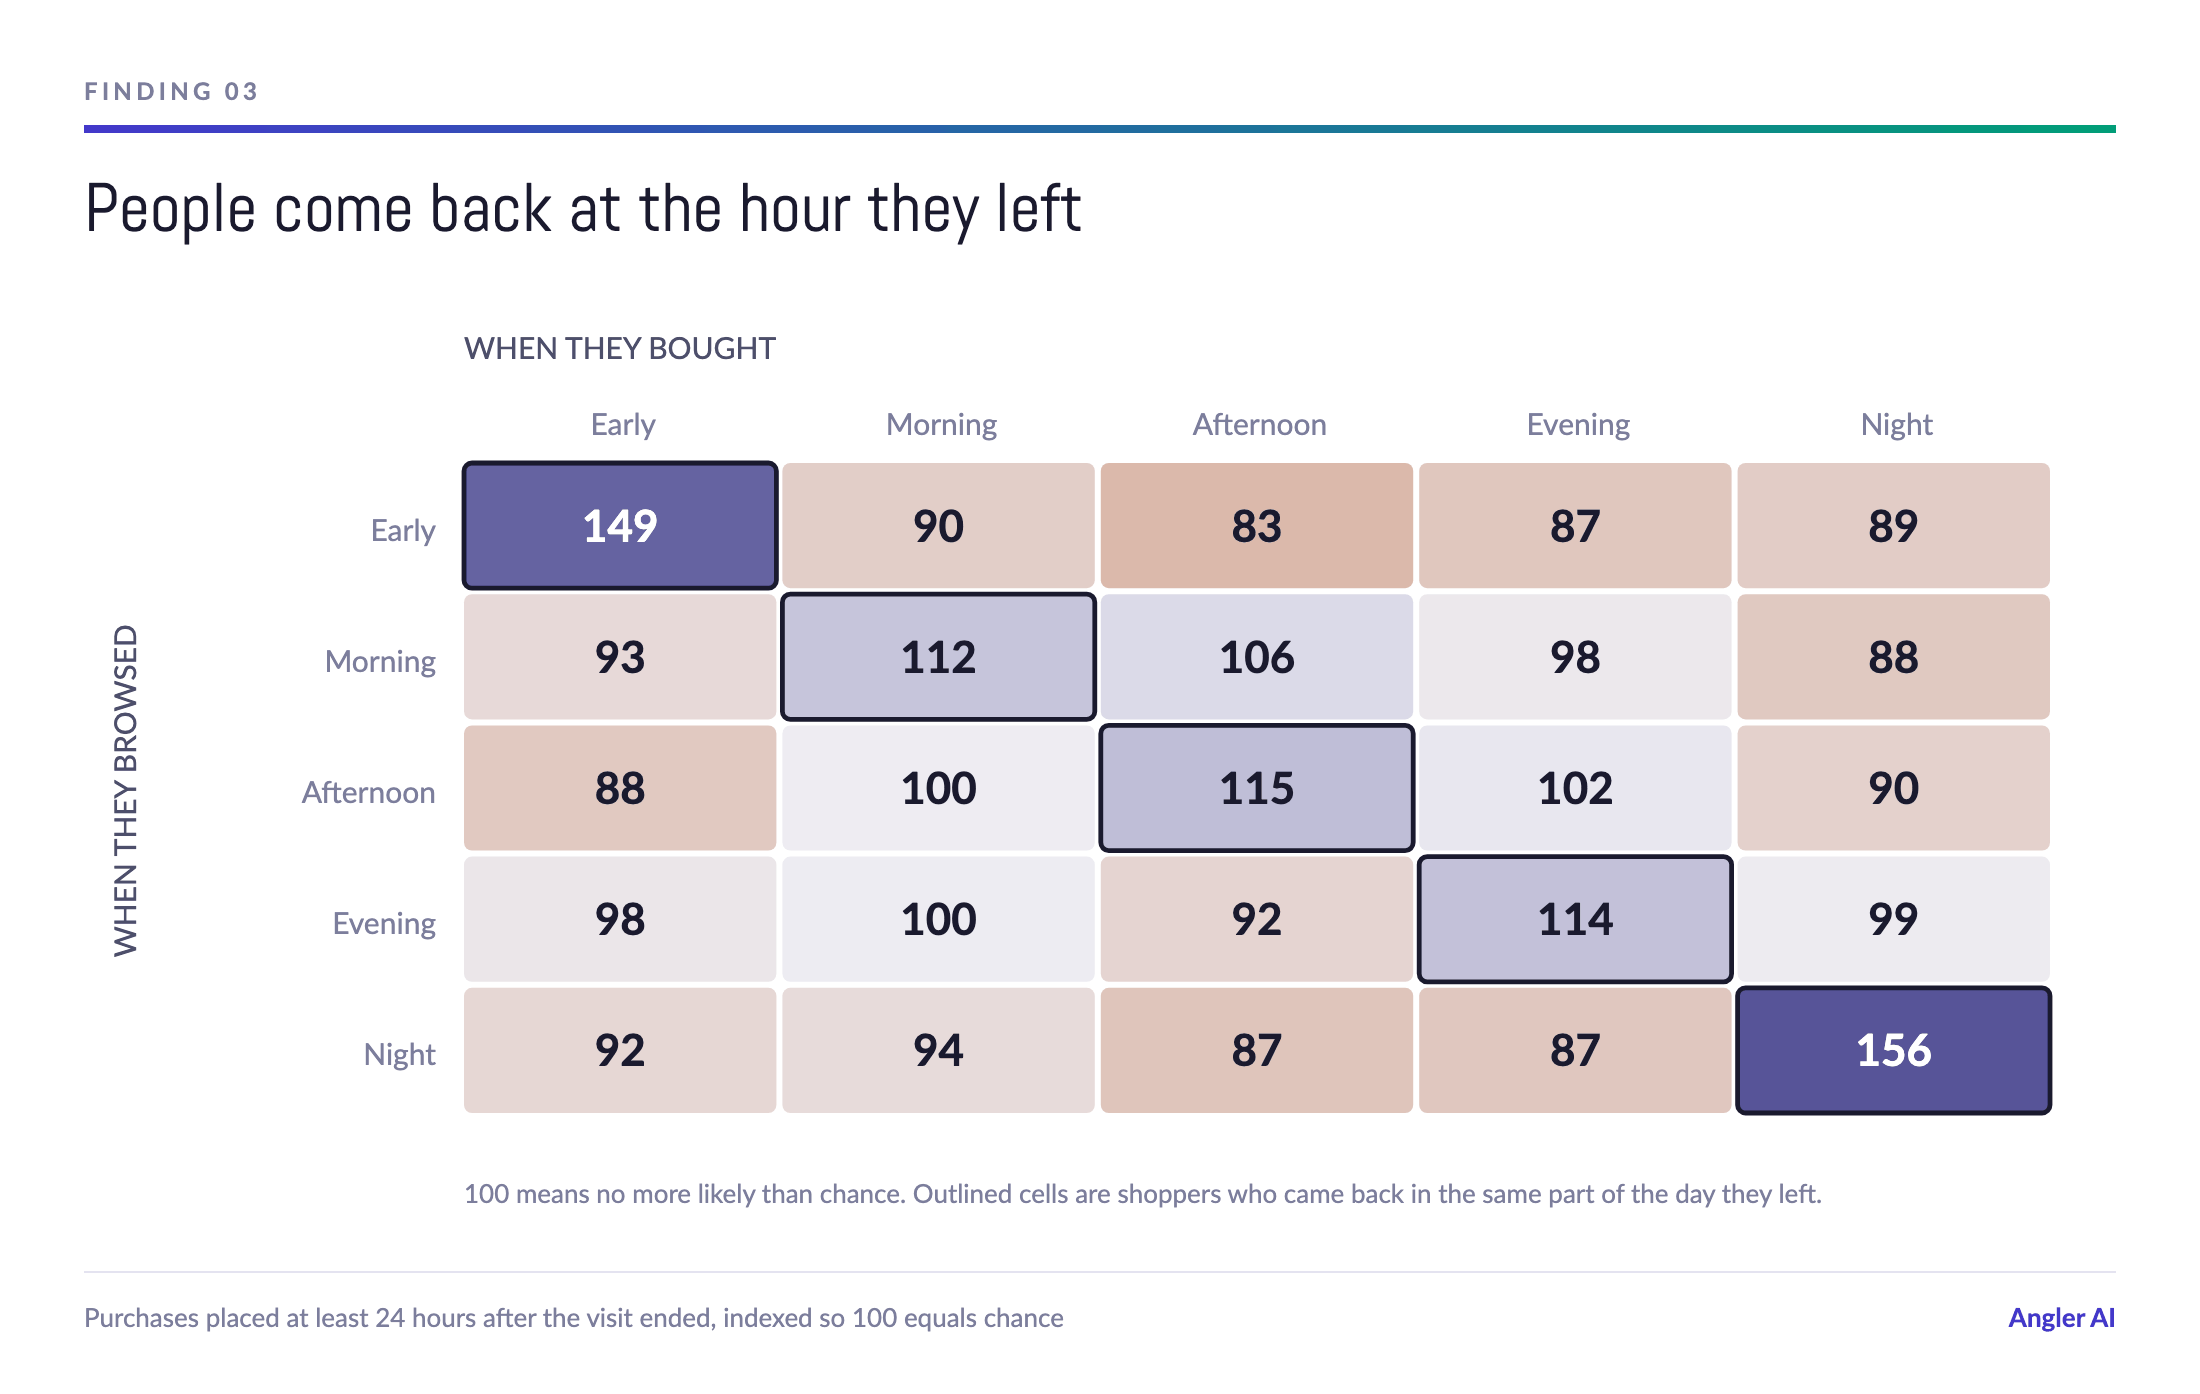
Take everyone who left in a given part of the day, and look at when they came back and bought. Not an hour later, which would just be someone finishing a checkout they had already started, but at least a full day later. A real return.
They come back at their own hour. Every time.
Someone who left early in the morning is about half again as likely as the chance to buy early in the morning. Someone who left late at night is 56 percent more likely to buy late at night. The same holds through the middle of the day, and it holds for new visitors and existing customers alike. In the grid above, the outlined cell is the highest number in its row in all five rows.
Put plainly: your shoppers have a slot. A commute, a lunch break, the hour after the kids go to bed. They browse in it, they leave, and days later they come back and buy in it.
We tested the obvious alternative, that this is really an email calendar showing through. It is not. A campaign leaves at a fixed time on the sender's clock and lands on people across four US timezones, so campaign driven timing would be sharply peaked in Eastern time and smeared in local time. We see the opposite. Existing customers turn out to be less concentrated in any one half hour than new visitors, not more. This is a habit, not a CRM send schedule.
Build prospecting audiences from the top 20 to 30 percent of the people who left. Treat the top 5 percent as its own tier. The efficient range is narrower than most prospecting setups assume, and the dense core at the top earns a higher bid than the pool it usually sits in.
Bid on predicted value, not just predicted likelihood. Revenue concentrates harder at the top of the ranking than order count does.
Pace against the shopper's own slot rather than one house wide schedule. This is the practical payoff of finding three, and the input it needs is a timestamp you already collect. Someone who left at 9pm on Tuesday is a better bet at 9pm on Thursday than at 2pm on Wednesday. Roughly a 25 to 30 percent edge in the right hour, against a 10 percent penalty in the wrong one.
Give departed new visitors and departed existing customers different rules. They differ eightfold in how often they come back, and they differ in shape: existing customers spill into the neighbouring part of the day, while new visitors hold to their slot more tightly.
None of this is exotic analysis. It is a joint distribution and a handful of ratios. It rarely surfaces because it needs three things at once, and most measurement setups have one or two.
You need predictions published live at the moment of the visit, not fitted afterwards on data that already contains the answer. You need a full holdout window, so a visit is never counted as a non converter simply because its purchase has not happened yet. And you need enough identity resolution to tie an order placed on Thursday morning back to a visit that ended on Tuesday night, often on a different device.
That is the layer Angler builds. A Foundation Ad Model turns a brand's first party data into predictions about who is worth reaching, and Predictive CAPI and Predictive Audiences carry those predictions into the ad auction as conversion signals and segments. The timing signal falls out of the same pipeline at no extra cost, because the visit timestamp was always sitting there. Most brands simply are not looking at it.
It is a purchase placed after the shopper has left the site, rather than during the visit itself. In this study we counted purchases made within seven days of a visit that had already ended, with in session purchasers excluded entirely.
Around 30 percent of returning purchases land within 24 hours and roughly 70 percent within three days, for both new visitors and existing customers. The tail runs to a full week, so a retargeting window that closes at 48 hours leaves roughly a third of the opportunity on the table.
Buying peaks at 7am in the shopper's local time, while browsing peaks at 8 to 9pm. On top of that daily rhythm, individual shoppers over return to the same part of the day they originally browsed in.
In this data the efficient range was the top 20 to 30 percent of visitors ranked by predicted likelihood to return. The top 20 percent captured 63 percent of the orders and 66 percent of the revenue. Beyond halfway, each additional slice of audience returned under 3 points of coverage.
We tested that directly and found no evidence for it. A campaign sends at a fixed time on the sender's clock, so campaign driven purchases would cluster in the sender's timezone. These cluster in the shopper's own timezone instead, and existing customers are less concentrated in any single half hour than new visitors, not more.
Based on nine consecutive days of live scoring for a national apparel retailer: 1.5 million visits, with in session purchasers excluded, and roughly 70,800 purchases placed within seven days of a visit that had already ended. Orders matched back by hashed email, phone or household. Timing figures use the shopper's own local timezone. Habit figures use purchases placed at least 24 hours after the visit, so someone completing a checkout cannot be mistaken for someone returning.