.png)
Platform AI now runs the auction. Feed it gross revenue and gross margin, and it will confidently optimize toward shoppers who look valuable, even when they return everything.
That is the hidden risk in Value and Profit-based bidding on Meta and Google. The platforms are only as good as the signals you give them. Send the wrong version of value, and the auction will push hard toward the wrong customers. You might not notice the damage until weeks later.
Today, AI makes more than 80% of ad-auction decisions.
On Meta and Google, you are no longer just choosing audiences, bids, and placements manually. They are feeding the platform signals, and the platform is deciding which shoppers to pursue and how much to pay for them.
That makes value optimization (maximize value of conversions, value-based bidding, target ROAS) one of the sharpest tools available to performance marketers. Aimed well, it can help platforms find your best customers. Aimed with the wrong signal, it can just as confidently optimize toward customers who look valuable in the moment, but return much of what they buy later. By the time that shows up in your reporting, the auction has already learned from the wrong data.
This is a two-part series. Part 1 focuses on the two value signals almost every retailer already sends: Value and Profit. Part 2 will cover pLTV, or predicted lifetime value.
Open the event parameters panel for your Purchase event and you will see the fields that power value optimization: Value, Profit, and pLTV.

At first glance, everything may look healthy. Coverage is green. Events are firing. The platform is receiving a number.
But coverage only confirms that a number is present. It does not confirm that the number is the right one.
And that is where many retailers run into trouble.
In retail and DTC, the default setup is straightforward:
Value = gross revenue
Profit = gross revenue × gross-margin percentage
It’s easy to pull from Shopify at checkout. Convenient, yes—but often wrong in ways that quietly cap performance.
The issue isn’t that gross revenue is fake. It’s that it’s incomplete. It’s only the first version of the truth.
It tells the platform what the customer bought. It doesn’t tell the platform what the customer kept.
Gross ignores one critical factor: a meaningful share of those orders come back.
U.S. online returns ran about 20% of orders in 2024, and clothing and shoes are the most-returned categories online.[1] Apparel sits around 25% and runs 20–40% in fashion sub-segments; footwear ~18% (up to 30%); home and furniture 15–20%.[2]
And returns aren't random.
Up to ~63% of online shoppers ‘bracket’ (buying multiple sizes or colors intending to keep one and return the rest) with size and fit driving 30–40% of all returns.[3] Gen Z admits to bracketing at roughly four times the Boomer rate.
Two things make this especially problematic for auction optimization.
First, returns cluster in the exact baskets you want most: large, high-AOV orders.
Second, refunds don’t show up immediately. They lag by 2–4 weeks, long after the conversion signal has already trained the auction.
The platform is stuck learning from revenue that never fully materializes.
Consider three anonymized new-customer orders from a DTC apparel brand.
Based on gross signals, the platform sees Order A at $1,190 and Order B at $1,000 as clear winners. It will aggressively try to find more shoppers like them.
But reality tells a different story.
Order A was returned in full. Net revenue: $0. Meanwhile, the smallest order—Order C at $642—kept everything and delivered the highest net revenue along with a strong margin.

Profit doesn’t fix the issue. It amplifies it.
Margins vary widely. Private-label products often carry higher margins than third-party or designer goods. And those high-AOV, heavily returned baskets? They tend to skew toward lower-margin items.
So a gross-margin Profit signal doesn’t just overstate value—it overstates it most where returns are highest.
In the example above, the fully returned order was assigned a Profit signal of roughly $650.
Actual profit: $0.
For 20–40% of apparel orders, gross revenue and gross margin are pre-return fiction. The auction can’t tell the difference. It optimizes to that fiction and ends up bidding up the cohort that returns the most.
Now zoom out.
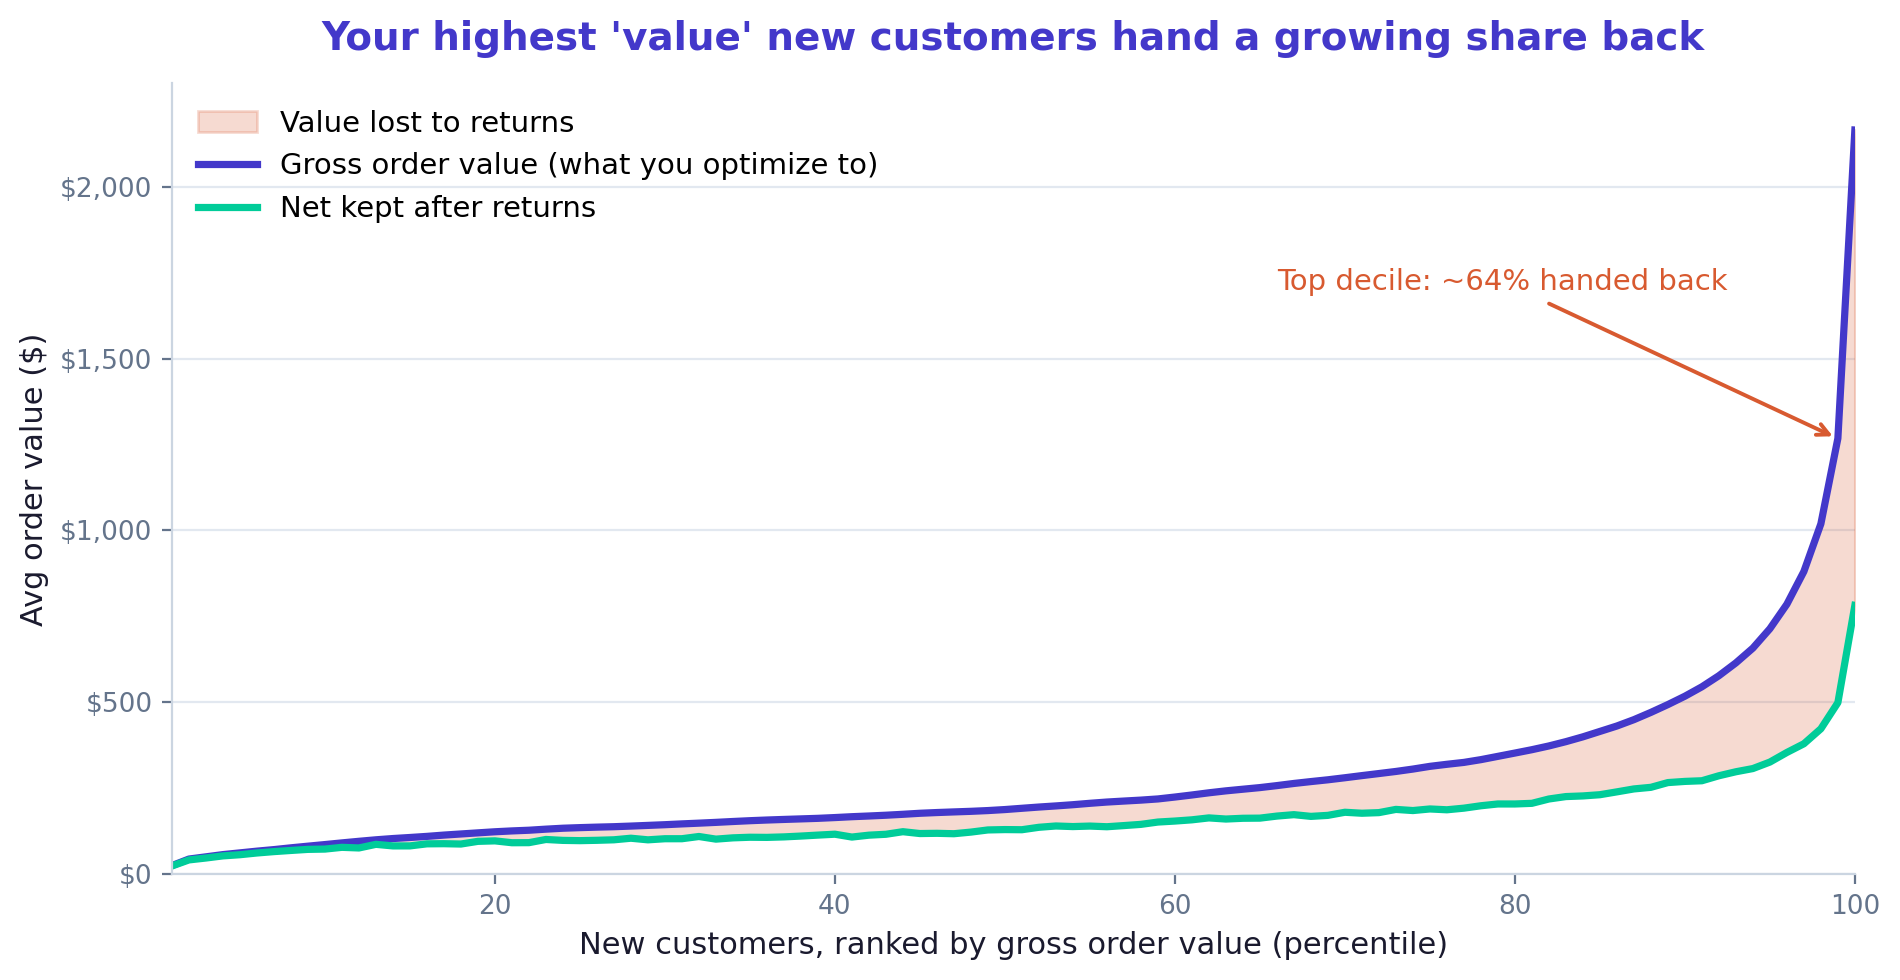
Rank every new customer by gross order value. As order size increases, so does the gap between what you optimize for and what you actually keep. The highest-value decile gives back the largest share.
Optimize on gross, and you systematically overpay to acquire the customers who return the most.
The solution isn’t to abandon value optimization. It’s to fix the signal.
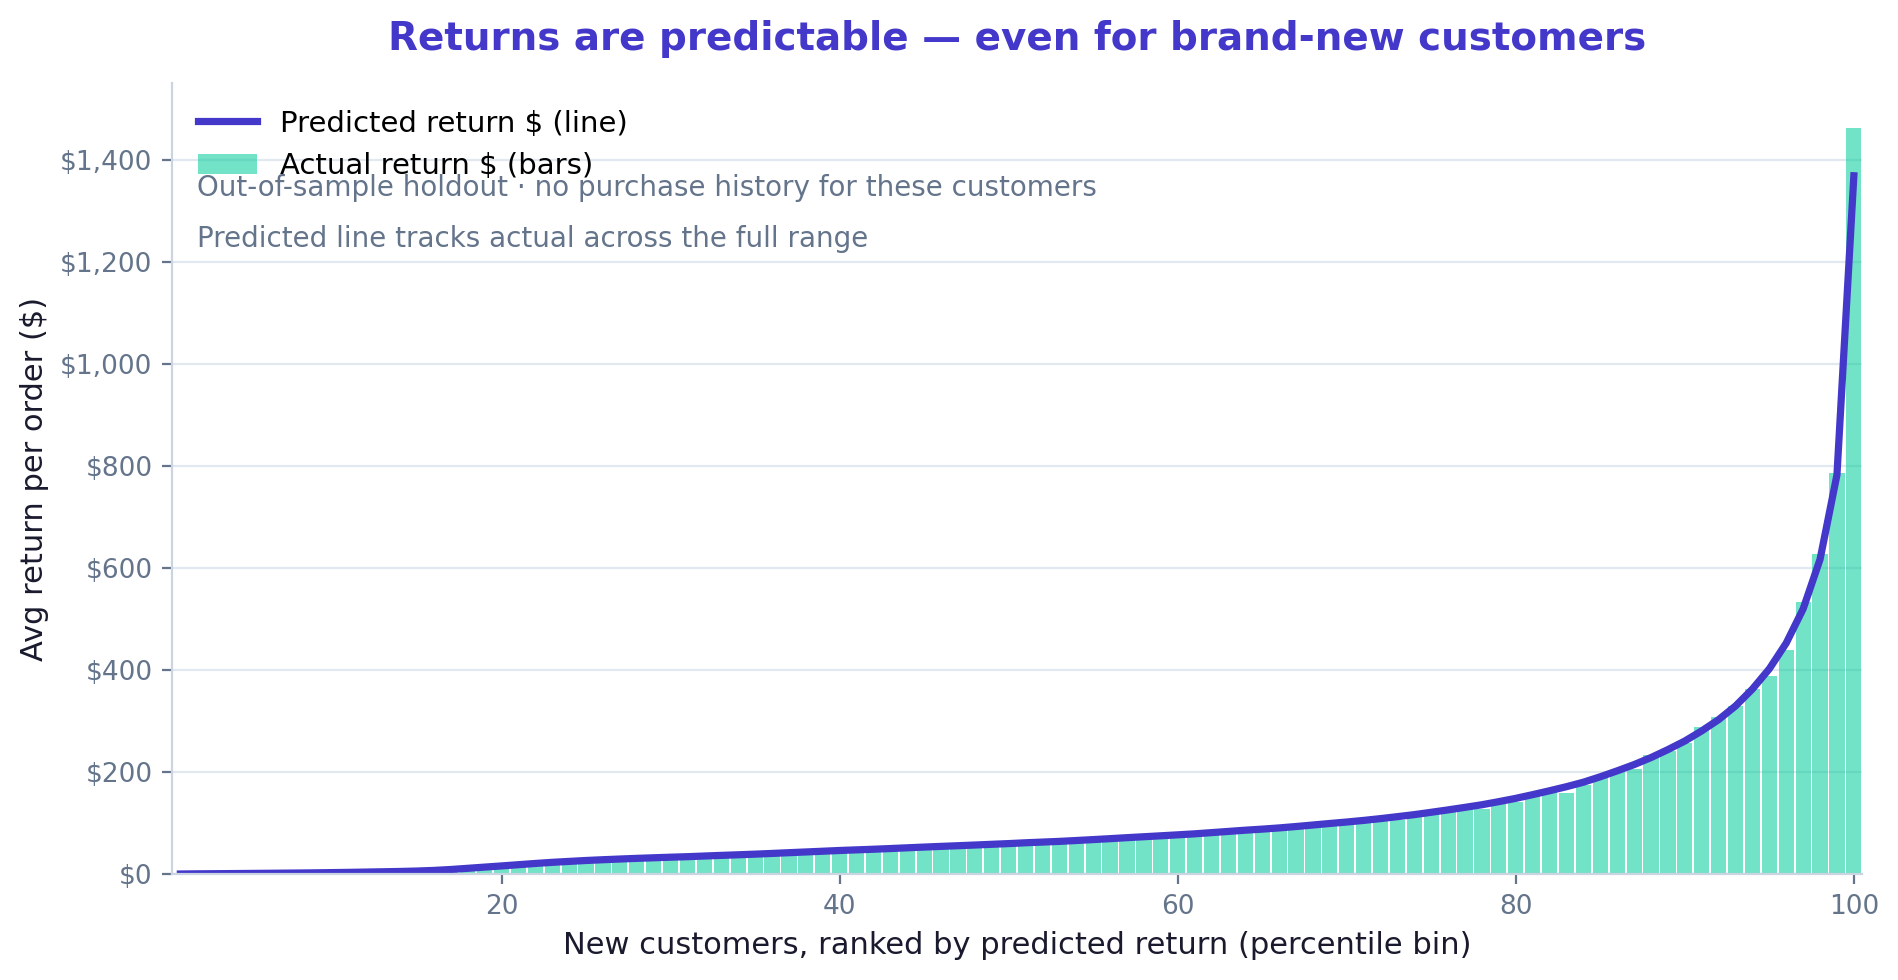
Returns are surprisingly predictable at the moment of purchase. Basket composition, bracketing behavior, multiple sizes, category, price band, even customer history—all of these provide strong clues about what will come back.
A Foundation Ad Model uses those signals to predict returns instantly. From there, it calculates expected net revenue and expected net margin.
Timing matters.
Refunds arrive weeks later—too late to influence the auction. Angler predicts and streams net value and net margin in near real time, right at order placement. That means Meta and Google learn from the money you’ll actually keep.
Immediately. Not weeks later.
And it holds up even in the toughest cases.
On a held-out sample of brand-new customers—where there’s no purchase history to rely on—predicted returns closely track actual outcomes across the full range. If it works here, it works everywhere.

Here’s how the same three orders look under each approach:
Angler’s predictions align closely with reality.
Gross signals don’t.
Audit what you send.
If Value equals gross revenue and Profit equals gross margin, you’re optimizing on pre-return numbers.
Switch the signal.
Use expected net revenue for Value and expected net margin for Profit.
Send it at order time.
Predicted net needs to reach the auction immediately. Waiting for refunds is too slow.
Measure on net.
Evaluate campaigns using net ROAS and contribution, not gross ROAS.
Make this shift, and value optimization stops cutting both ways. Instead, it becomes a real advantage—the auction finally targets customers who are actually worth the most.
In Part 2, we’ll extend this approach beyond the first order to pLTV.
--------------------------------------
[1] National Retail Federation, 2024 consumer returns (~$890B; ~20% of online orders); Statista, most-returned online categories (clothing & shoes). statista.com/chart/34373
[2] Ecommerce return-rate benchmarks by category (apparel ~25%, footwear ~18%, home 15–20%). richpanel.com/learn/ecommerce-return-rates
[3] Bracketing behavior (~60–63% of online shoppers; size/fit ~30–40% of returns; Gen Z ~4× Boomer rate). Loop Returns / Returnalyze. returnalyze.com/blog/breaking-down-bracketing