Part 1 of this series — Value Optimization Is a Sharp Stick — argued that most retailers hand the auction a pre-return fiction: gross revenue as “value” and gross margin as “profit.” Feed that in and platform AI dutifully goes and finds you more of the customers who return the most merchandise. The fix was to send predicted net revenue and net margin for the current order.
This part goes one step further out in time. Getting the current order right is table stakes. The prize the platforms are now opening up is the next order, and the one after that — bidding on what a customer will be worth over 90, 180 or 365 days, at the moment you are deciding whether to pay for them.
Both walled gardens have converged on the same idea from different directions: let the advertiser define value, and let the auction optimize against that definition rather than against a conversion count.
Two capabilities matter most, and they are new enough that most advertisers have not built for them yet:
The platforms have moved the hard part to your side of the wall. They will optimize against any value definition you can produce, refresh, and deliver fast enough. Producing it is the work.
Plenty of sophisticated advertisers have been doing a version of this for years, unofficially. It is usually called value hacking: overwrite the value field on the purchase event with something other than order value — a pLTV score, a margin estimate, a tiered multiplier — and let the platform’s existing value optimizer chase it.
It works, up to a point. But native pLTV support is a materially different thing, in three ways.
That last row is the one that quietly costs teams the most. Once the value field is carrying a prediction, every ROAS number in the account is a prediction too, and nobody downstream knows it. Keeping current order value in value and the forecast in its own predicted_ltv parameter means finance and marketing can keep reading the same account without translating.
On Meta, the prediction rides in custom_data next to the order value rather than on top of it — value stays the real transaction, predicted_ltv carries the forecast:
{
  "event_name": "Purchase",
  "event_time": 1633552688,
  "action_source": "website",
  "custom_data": {
    "currency": "USD",
    "value": 142.52,
    "predicted_ltv": 678.9
  }
}
If your model needs more time than the checkout does, you send the conversion event as usual and follow it with a separate AppendValue event that Meta matches back to the original using event_id and/or order_id in original_event_data. On Google, the equivalent move is a conversion adjustment keyed to the transaction or order ID.
Worth checking against your account before anyone scopes engineering time. To use pLTV value optimization on Meta today you need:
Supported events are Purchase, Subscribe, StartTrial, CompleteRegistration, AddPaymentInfo and custom events. Full detail in Meta’s pLTV integration guidance.
Value optimization forces a decision most organizations have deferred: which number are we buying against? Revenue is easy and usually wrong. Gross margin is better. Net revenue after returns is a lot better in any category with meaningful returns. Contribution margin after shipping, payment and variable fulfilment costs is closest to what the business actually banks.
This is a rare opportunity to align the CMO and the CFO on one shared definition and then codify it — not in a deck, but in the feature definitions of a model and the payload of an event. Once it is codified, the argument about whether performance marketing is “working” gets a lot shorter.
Non-monetary value counts too. A high-value user action — a registration that historically converts at 4×, a first subscribe-and-save enrollment, an app install that reaches a retention milestone — can carry a value score even when no revenue has changed hands.
This is where most in-house attempts stall. Three requirements, all non-negotiable:
Post-purchase pLTV is the obvious half. Pre-purchase pLTV, a forecast of what a visitor will be worth, conditioned on them converting at all, is the half that changes prospecting economics. It gets its own section below, because it is also the half most advertisers skip.
Prediction pipelines and signal pipelines are usually built by different teams, and the seam between them is where value optimization programs die. The pipeline needs to emit predictions in the format each platform accepts — Meta and Google have different protocols, different objects, and different update mechanics — and push an update when a customer’s pLTV moves materially, not on a nightly batch schedule because that was easier to build.
The argument for pre-purchase pLTV is a sparsity-versus-noise trade-off, and it is worth being precise about it.
If you only attach pLTV to the purchase event, you have given the auction a beautifully discriminating label on a vanishingly small number of labels (rows). Platform AI needs to learn enough across all your campaigns, ad sets, creatives, copy variants and placements. Every one of those cells needs enough labelled events to learn from.
This is not a small-advertiser problem. A brand spending $100M+ a year still runs out of labelled purchase events once volume is divided across a live creative matrix. The result is an auction that has an excellent value signal it cannot act on with any confidence, because the evidence is too thin at the level where decisions get made.
Send pre-purchase signals in addition, and the arithmetic changes. Every session, product view, cart and checkout carries a graded value — a conversion propensity multiplied by a predicted LTV conditioned on converting. The auction now trains on full-funnel volume without giving up the value discrimination that made pLTV worth doing.
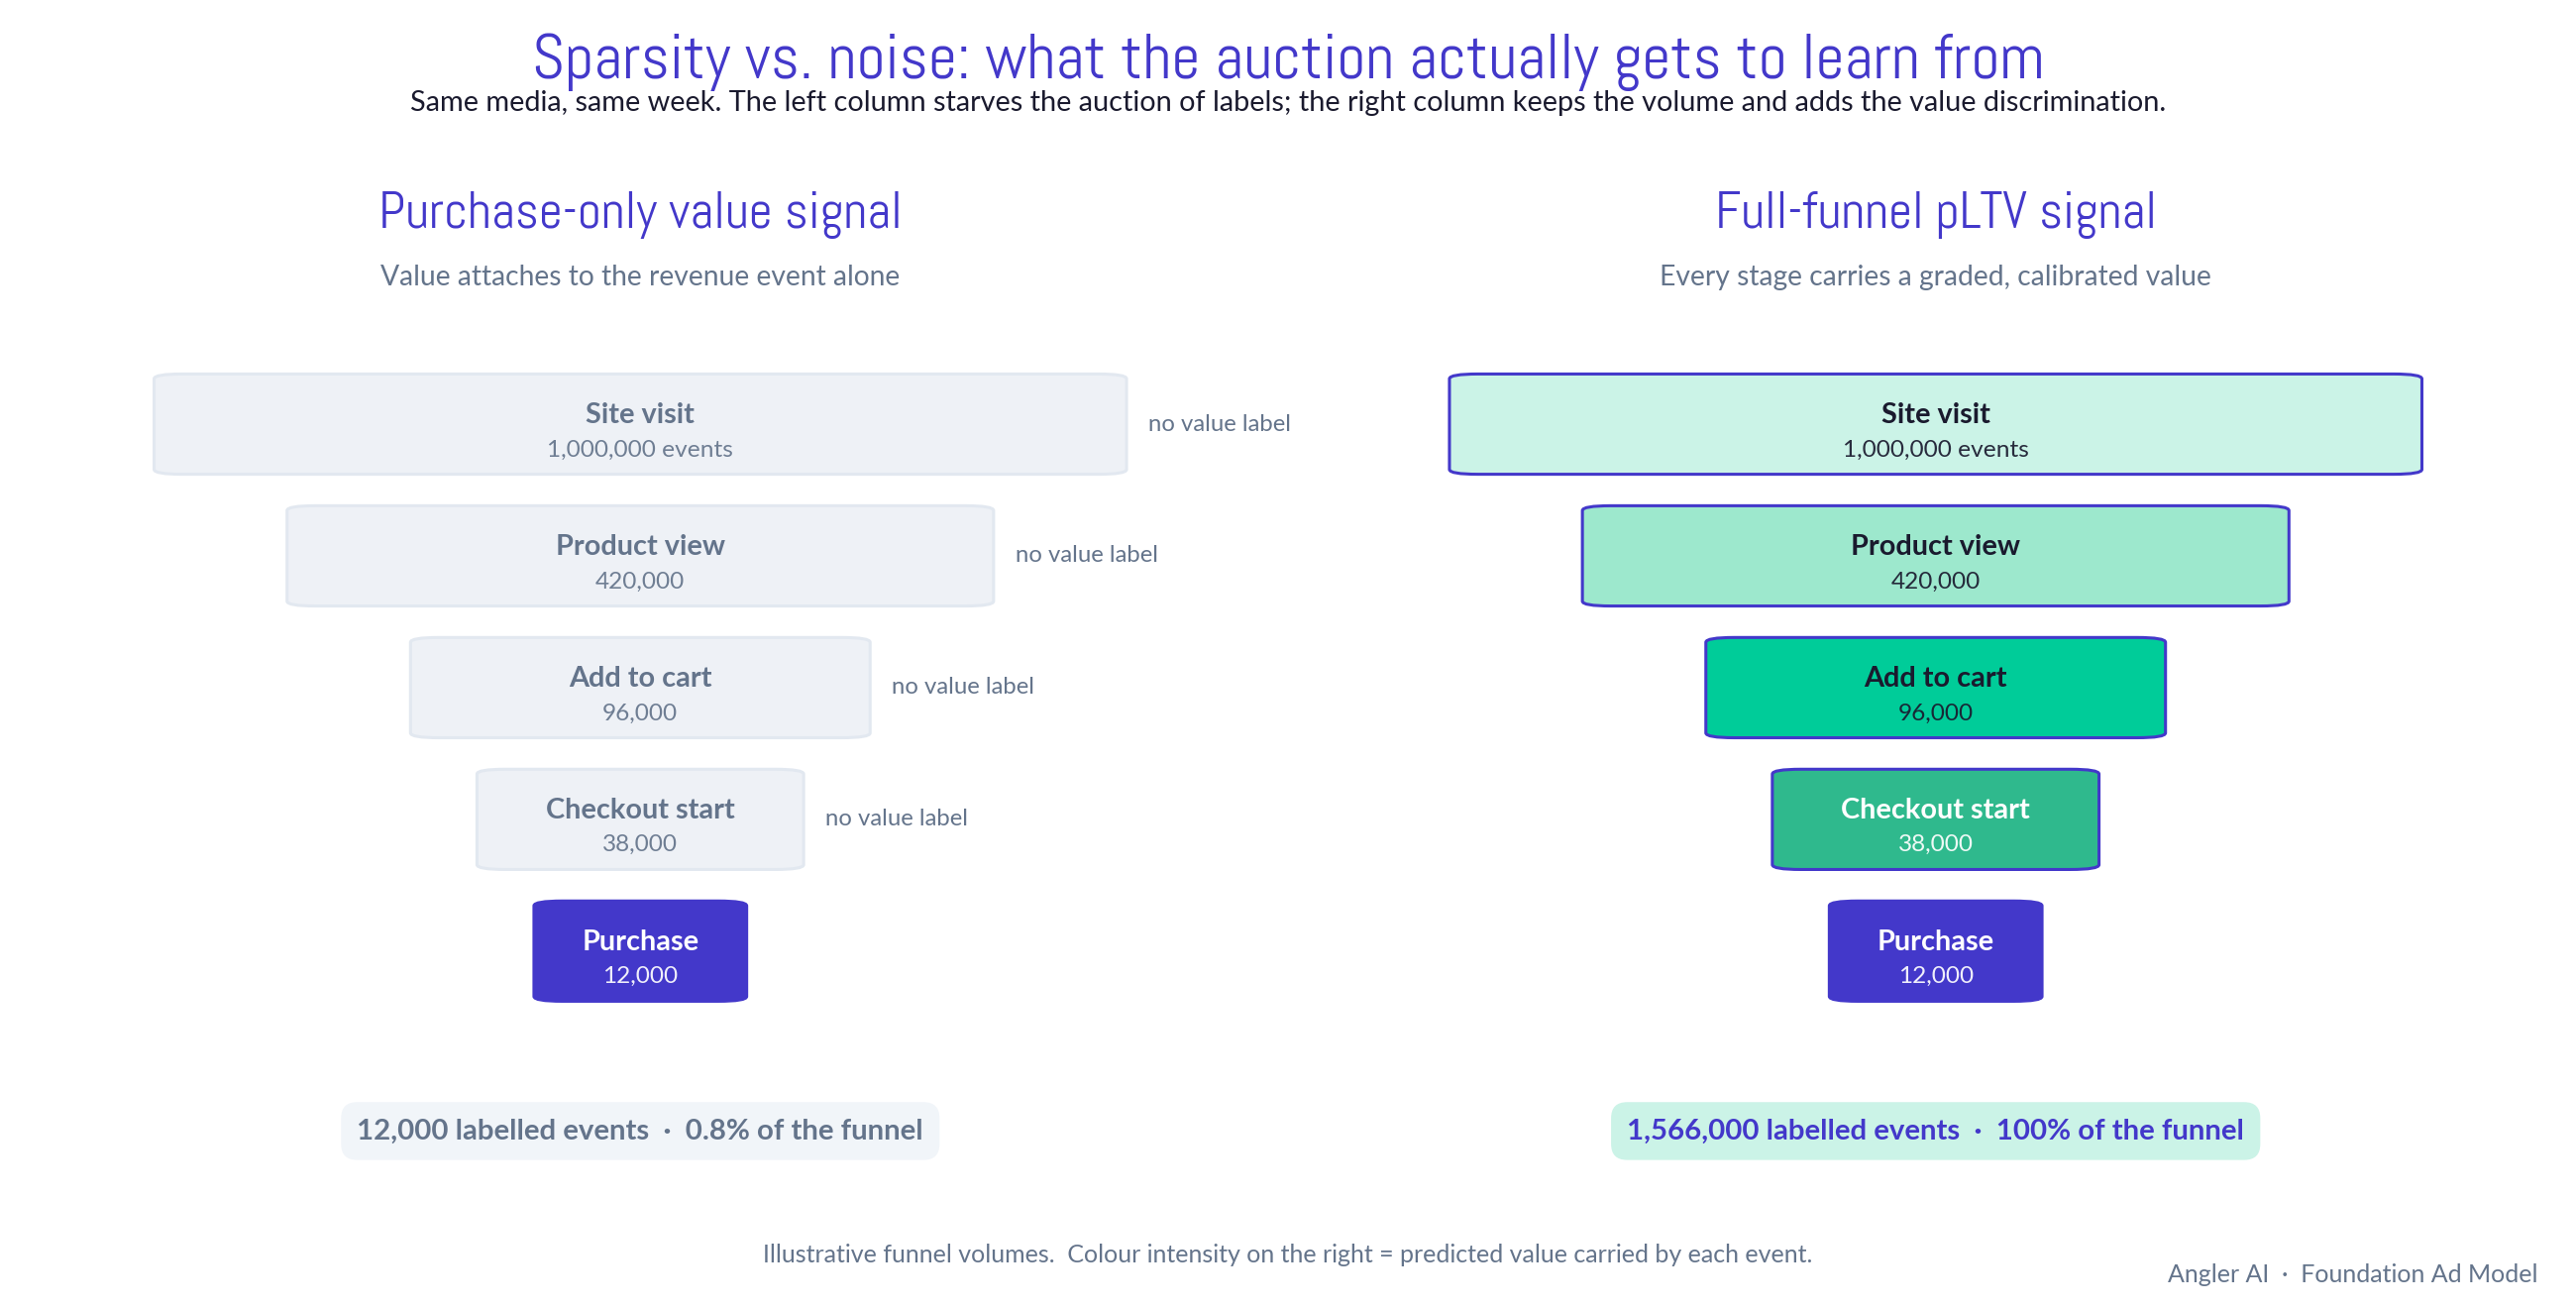
The trade-off: Purchase-only pLTV is low-noise and far too sparse. Unvalued upper and mid funnel events are high volume and carry no value information at all. Pre-purchase pLTV is the only option that gives you both: full-funnel volume with a value gradient across every event.
Whatever value equation you pick has to be computed the same way when you train the model and when you serve predictions in production. That sounds obvious and it breaks constantly, usually through cost data.
A worked example: you are modelling gross margin, and your cost table holds current standard cost. You train on three years of orders, computing each order’s margin using today’s cost. An order from two years ago is now scored against a cost that did not exist when it was placed. Costs move — commodity prices, freight, supplier renegotiations, private-label mix — so you have just baked a systematic bias into every historical label, and the model learns a margin structure that never happened. Cost has to be as-of the order date, in training and in production.
If you are modelling net revenue or net margin — and in apparel, footwear or fashion retail you should be, for the reasons laid out in Part 1 — then production needs a returns prediction model too. At the moment the order is placed you do not know what will come back, so expected net revenue on the current order is itself a prediction. Skip it and you are back to optimizing against a pre-return fiction, just with more machinery.
Feature leakage is when information that would not have been available at prediction time sneaks into a training feature. The model looks brilliant offline and falls apart in production, because in production the future has not happened yet.
The canonical example in this domain: lifetime total order count. It is a genuinely strong feature — customers who have ordered more tend to keep ordering. But if you compute it as the total in your database today, then for a customer’s first order in 2024 you have handed the model the fact that they went on to place eleven more. Trained that way, the model learns to read the future. In production it gets a 1 and predicts like a one-time buyer.
Every historical feature has to be imputed as of the moment of prediction — order count as of that timestamp, days since last order as of that timestamp, category affinity built only from events that had already occurred. This is tedious and there is no shortcut.
Aggregate accuracy metrics hide the segments that matter. The opportunity in pLTV bidding is concentrated in exactly the segments that are hardest to predict, so that is where evaluation should concentrate:
Native pLTV support is new. Google’s value-based bidding has been around longer and is comparatively mature; Meta’s pLTV offering is newer, and there are constraints worth planning around today.
None of these are reasons to wait. They are reasons to design the integration knowing where the edges currently are — and we expect most of them to loosen as pLTV bidding moves from early adopters into mainstream use.
This is the problem the Foundation Ad Model was built for. A few things we have learned are worth doing properly:
Revenue, gross margin, net revenue, net margin, contribution margin, or a non-monetary score on a high-value action — the value equation is a configuration, not a rebuild. Where current order value itself has to be modelled (net revenue or net margin), that is supported out of the box: two models run in unison, one predicting the net value of the current order, one predicting future value excluding it.
Pre-purchase predictions are broken out by conversion propensity and pLTV conditioned on conversion, so the auction gets a value gradient across the whole funnel rather than a sharp label on 1% of it.
Predictions are available per entity — per customer, per order — and land in your data warehouse, where your own data and marketing teams can inspect them. Before a dollar of media is bid on a prediction, we run seal-the-envelope testing: predictions are generated from the production environment, sealed, and then tracked against actuals as the cohort matures. It simulates the real use case rather than a backtest, and it is how teams build conviction before committing budget.
Automated monitoring for model drift and feature shift, plus graceful handling of features the model has never seen — a new discount code appearing on a Tuesday should not degrade predictions while someone retrains. Models retrain on a schedule and on demand, which matters most for retailers heading into a peak period where behaviour changes faster than any fixed cadence.
Fair question, and the only honest way to answer it is with out-of-sample results on the hard problems, not the easy ones. The charts below are from held-out data with no overlap with the training period.
Difficulty runs in this order: pre-purchase prediction is hardest, new-customer prediction next, returning-customer prediction easiest.
Every score below is generated before the visitor has ever bought, from on-site behaviour alone, with no purchase history to learn from. Prospects only; returning customers excluded. 877,735 prospect sessions in a held-out test week, sorted into 20 bands of 5% by predicted 90-day LTV.
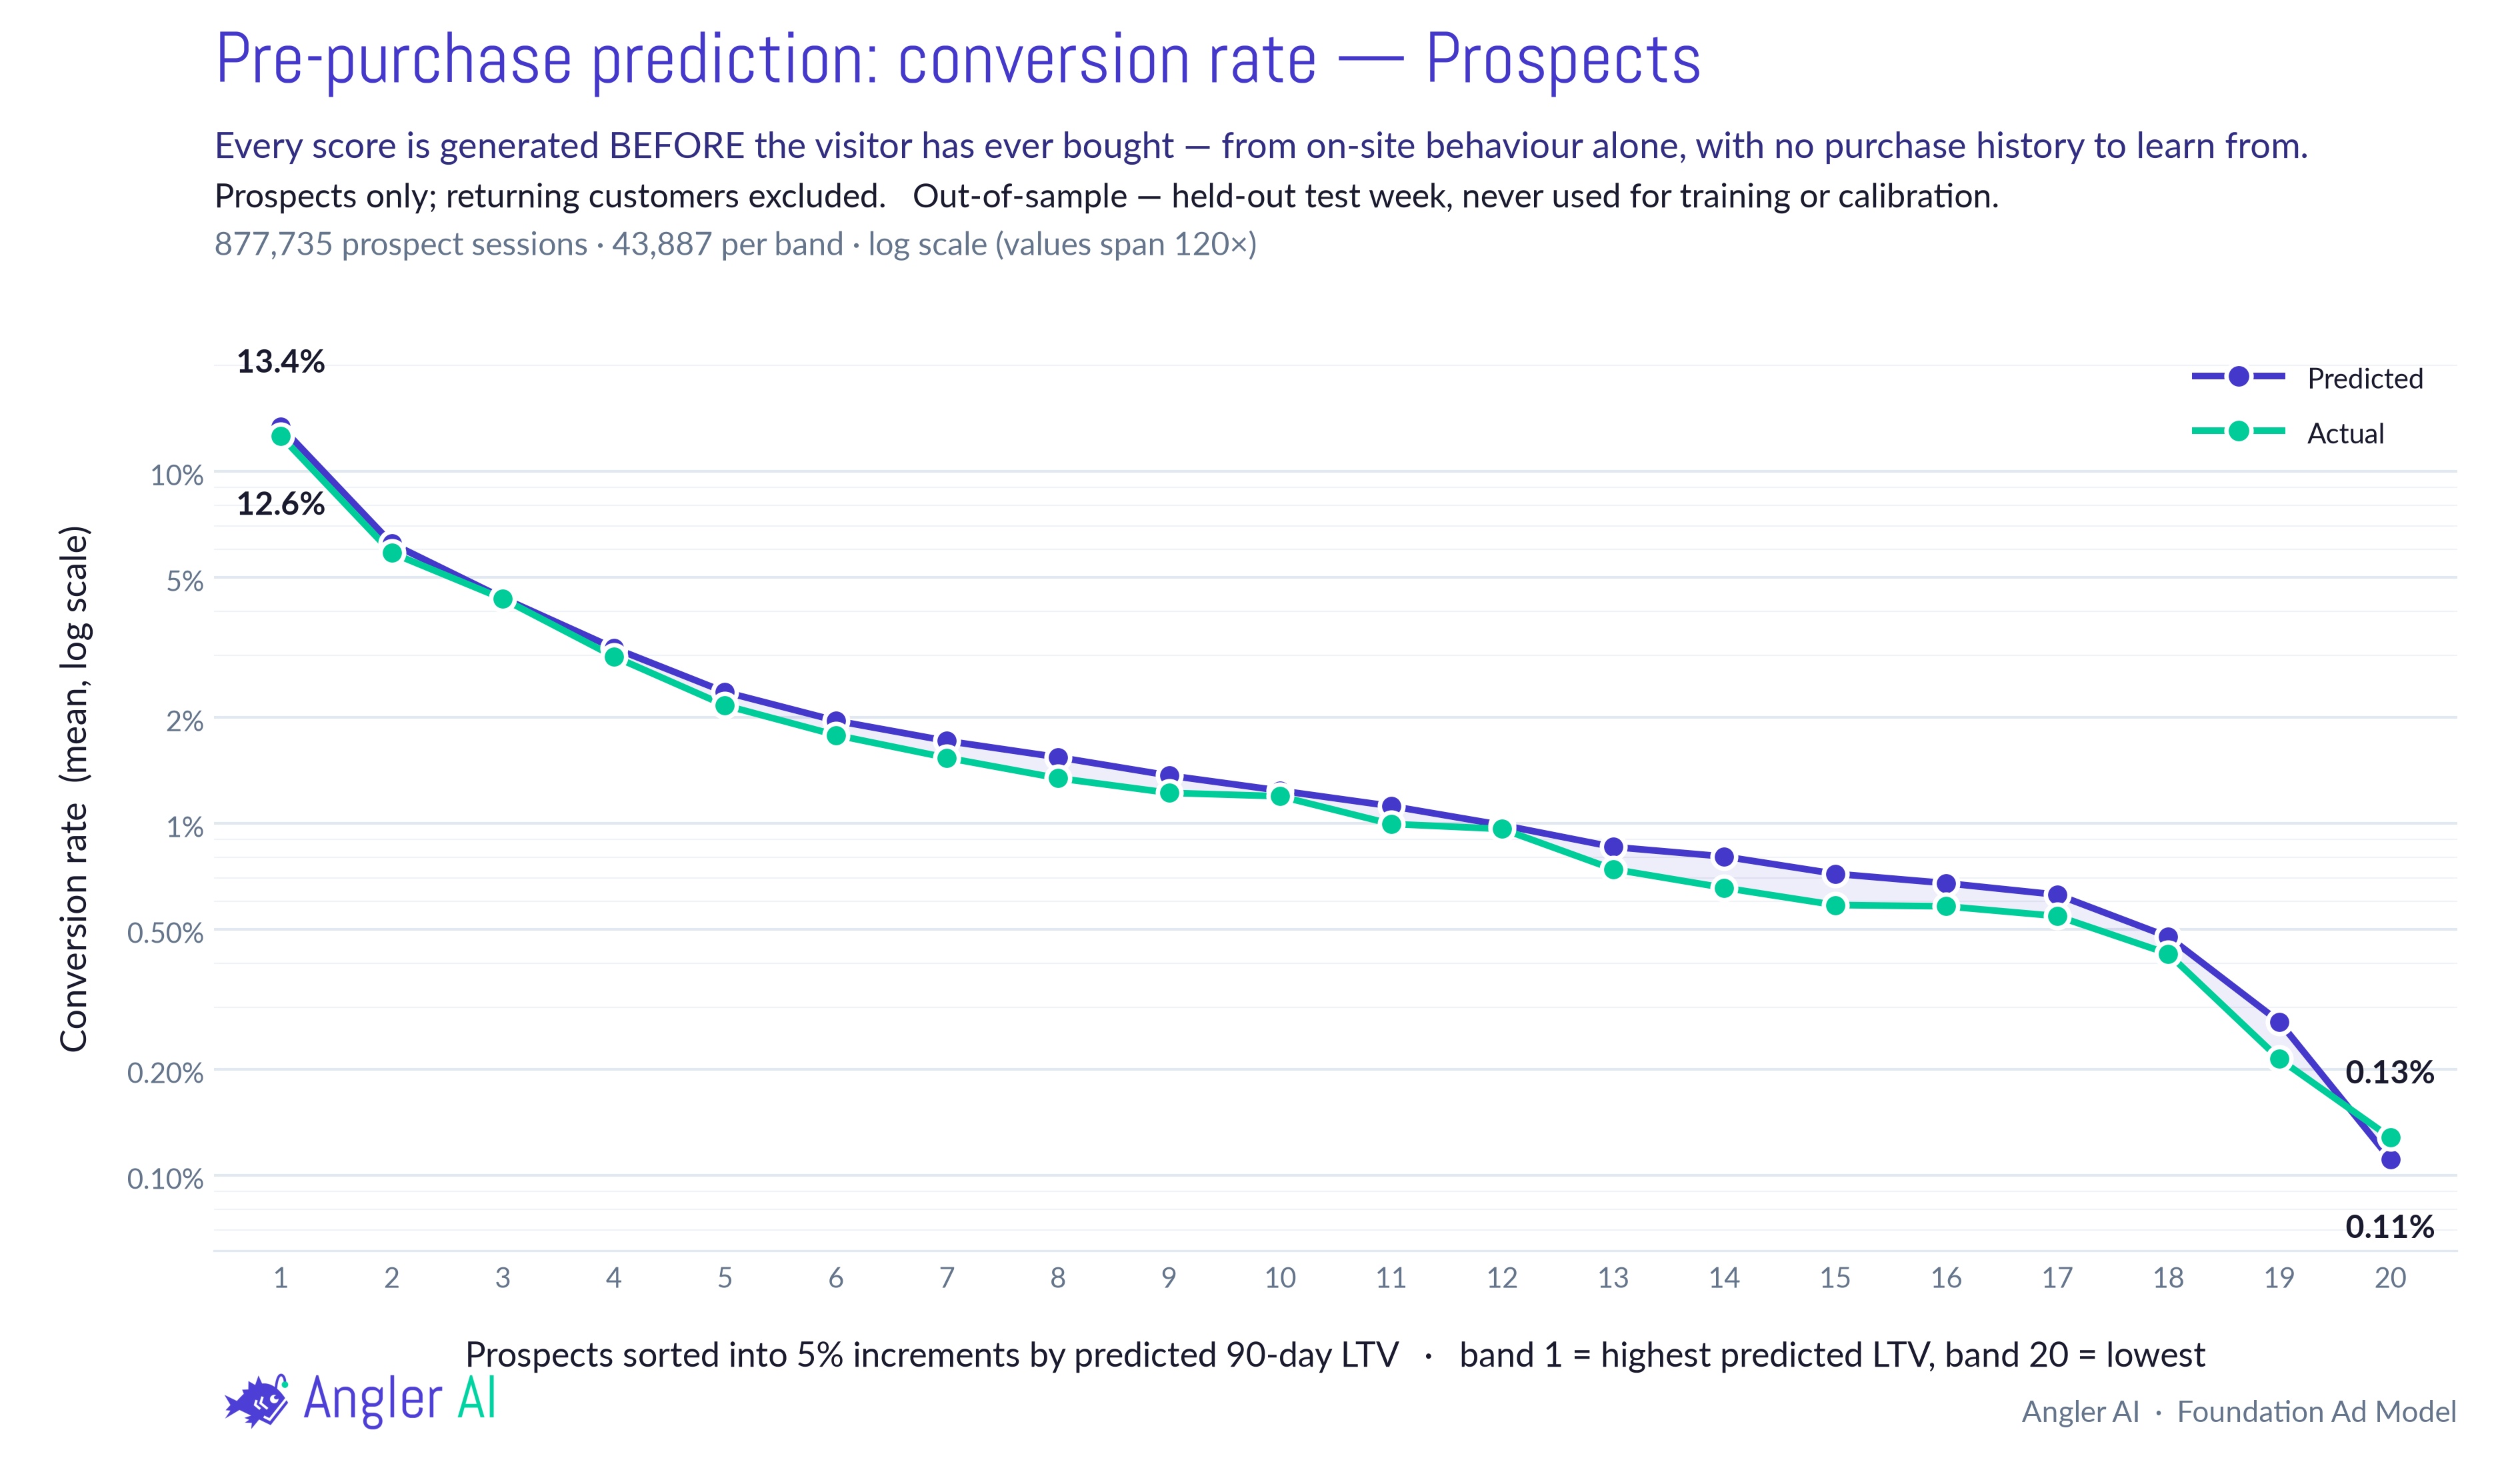
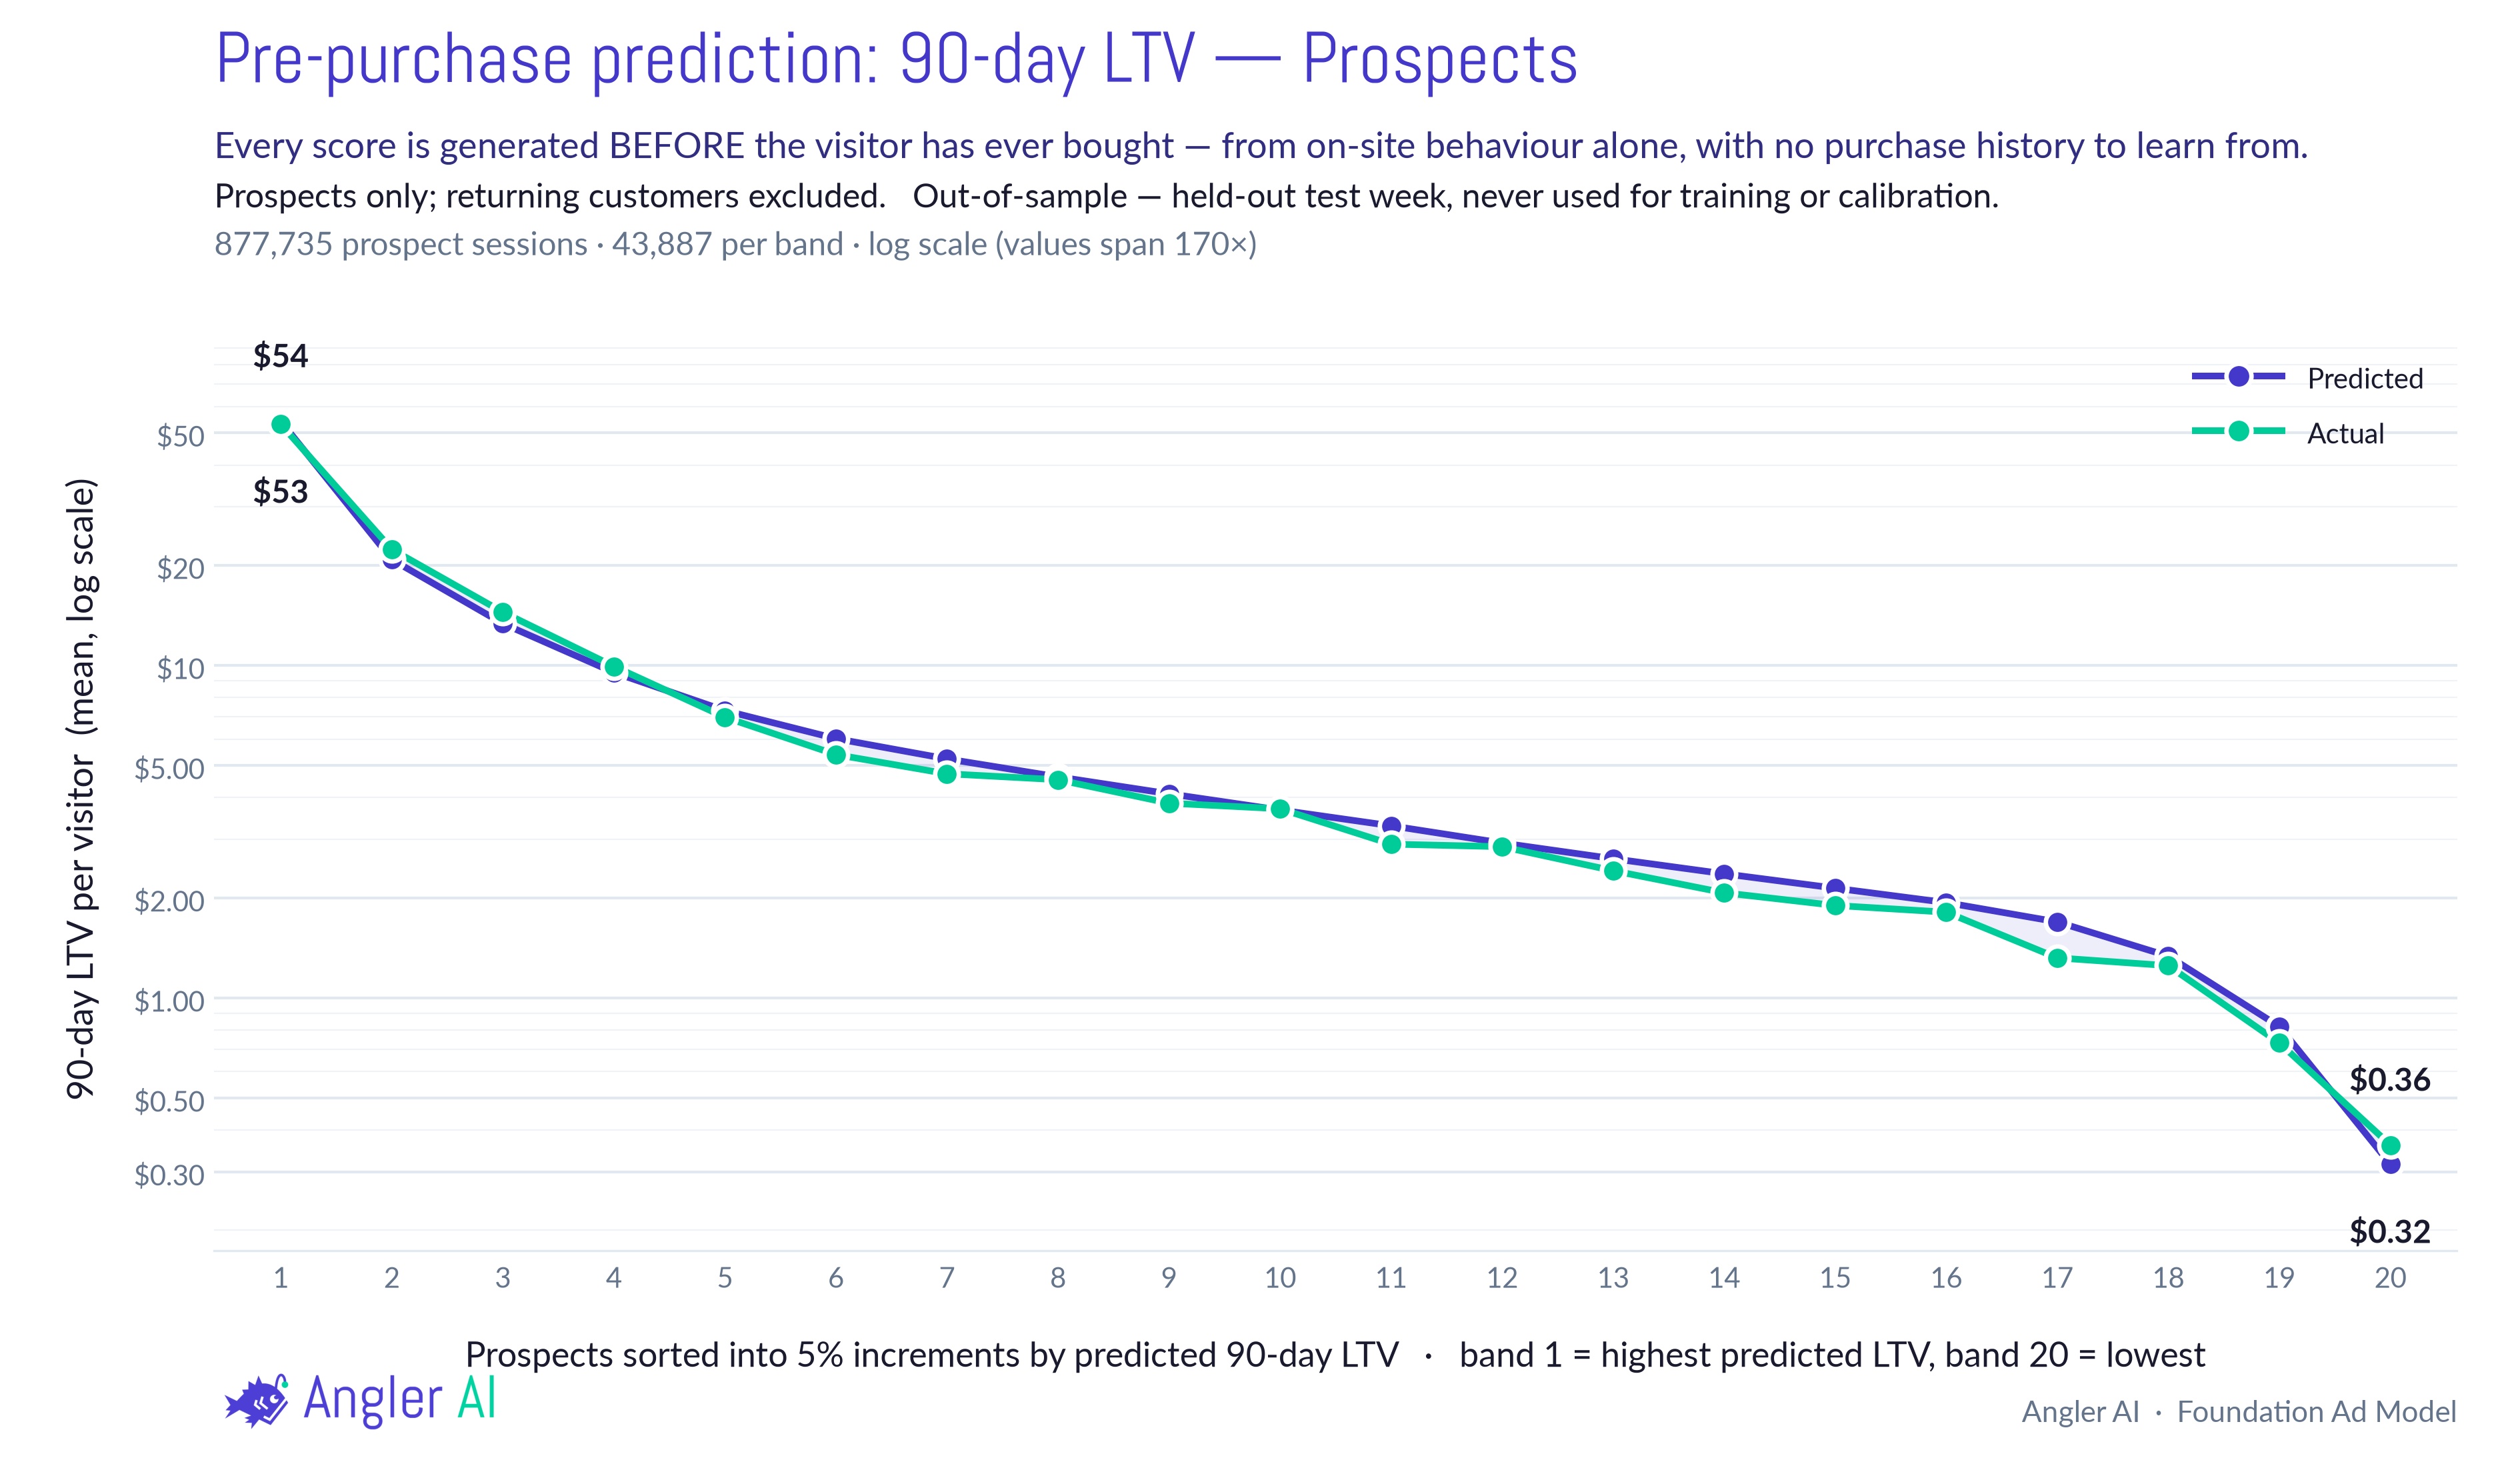
Two things matter here. The model separates non-converters from converters across two orders of magnitude, and among the visitors it does expect to convert, it separates high future value from low. That is precisely the discrimination the auction needs on upper-funnel events.
First-order customers, ranked into 100 equal buckets of 1% each by predicted 90-day LTV, on a non-overlapping holdout of 315,681 new customers.
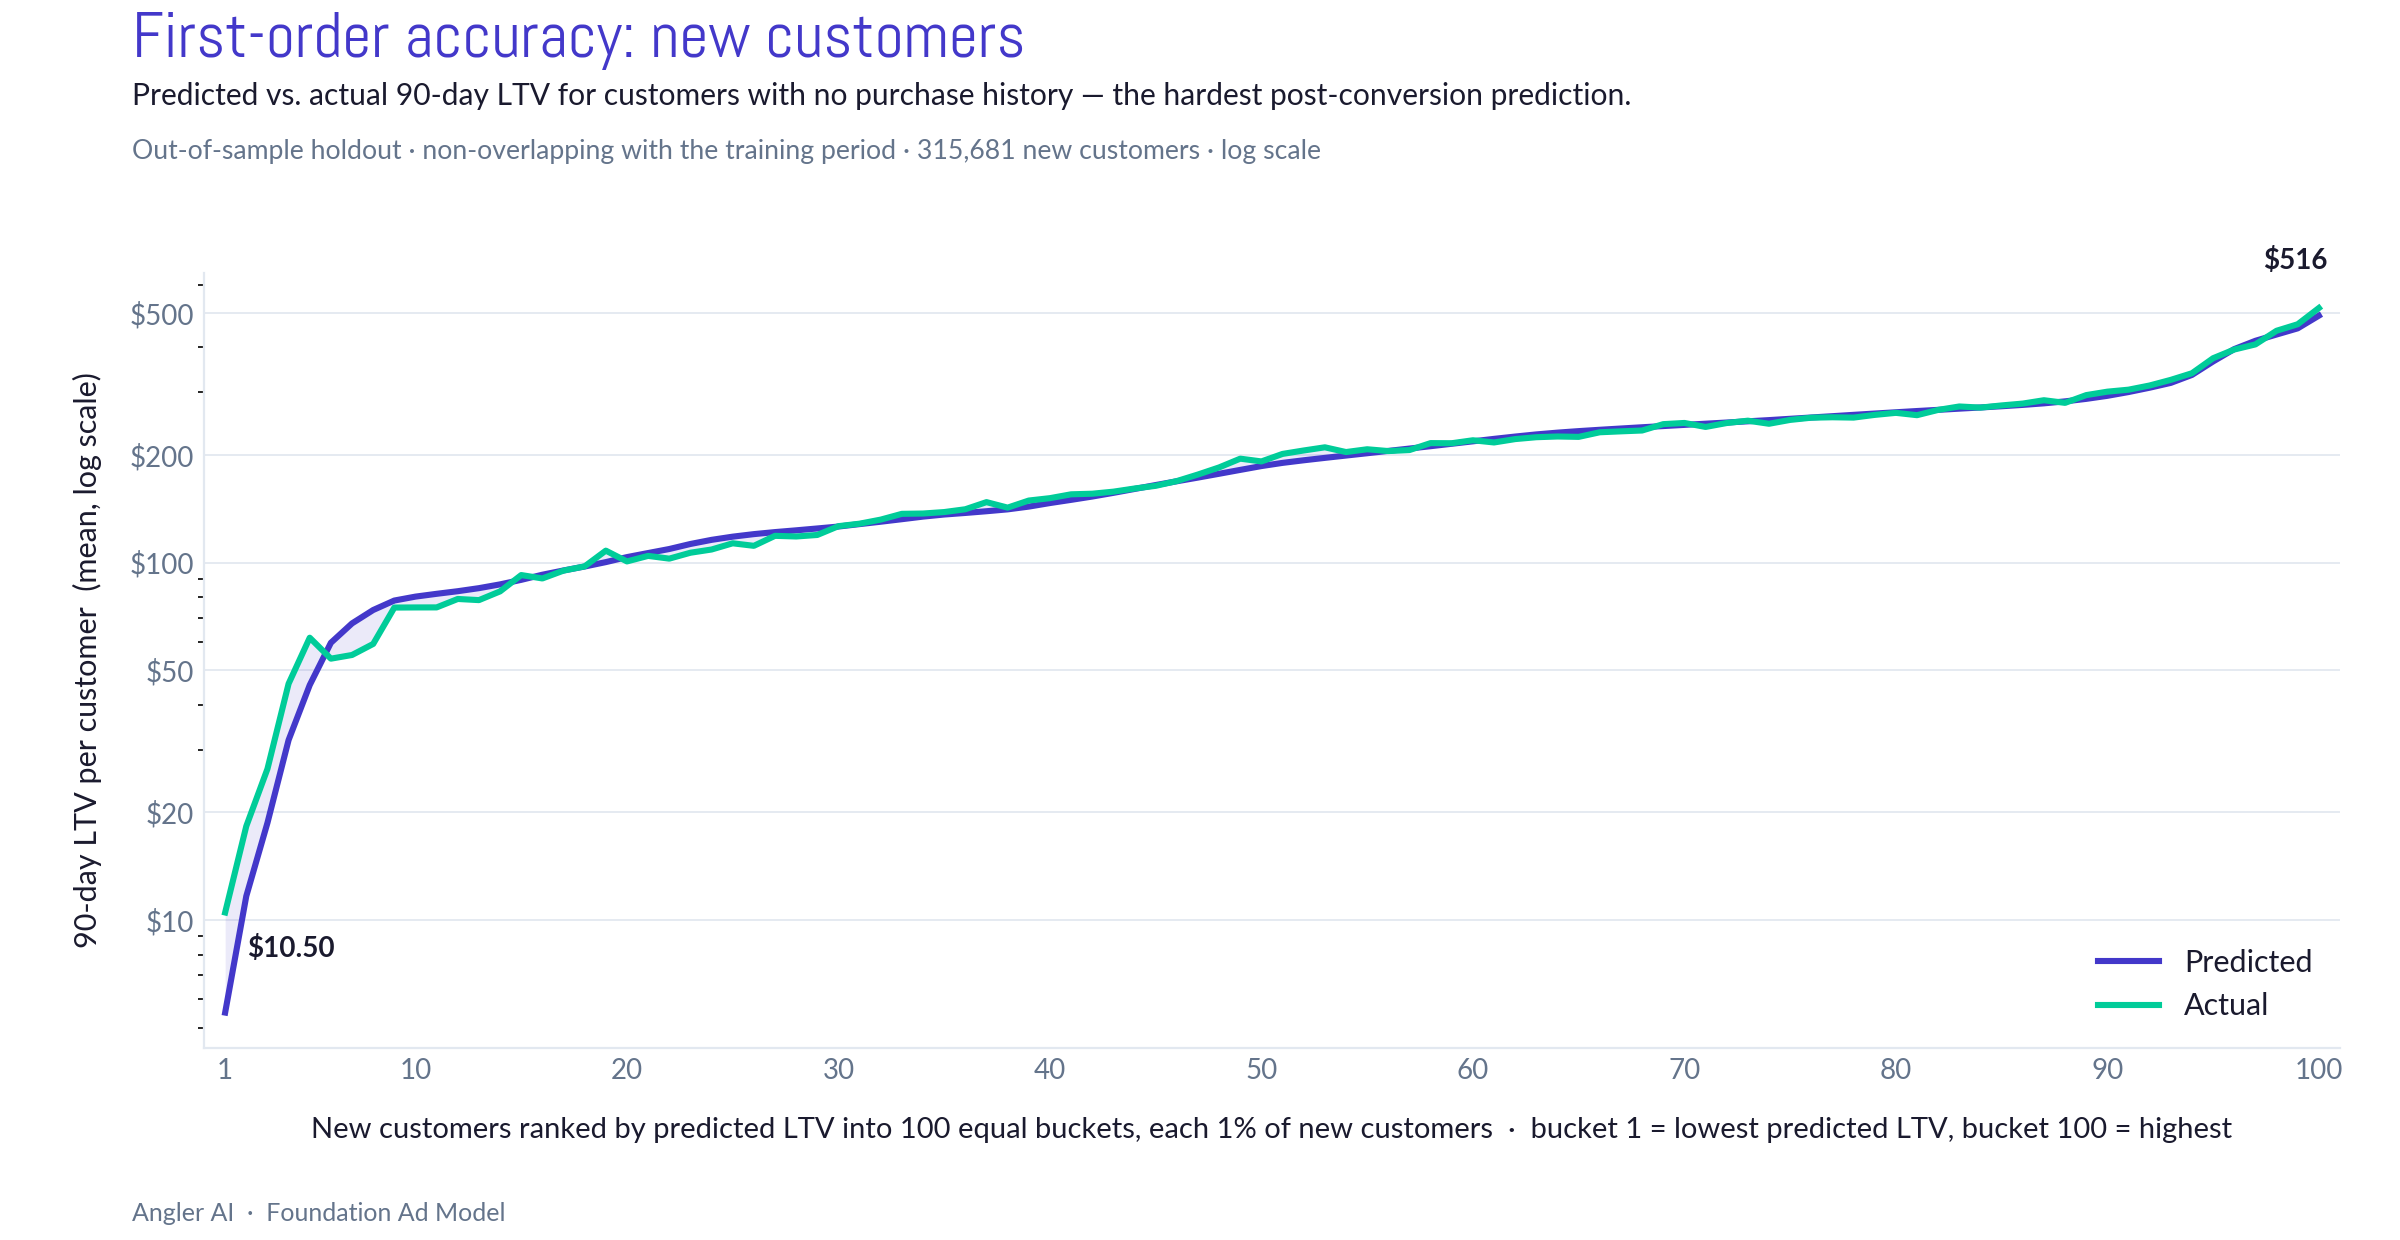
The deepest buckets are where the model is least precise, and we would rather show that than crop it. In a bidding context it matters less than it looks: the decision the auction is making is whether this prospect belongs in the top decile or the bottom one, and on that question the model is unambiguous.
Returning-customer orders, ranked into 100 buckets of equal order volume, on a holdout of 1,936,713 orders.
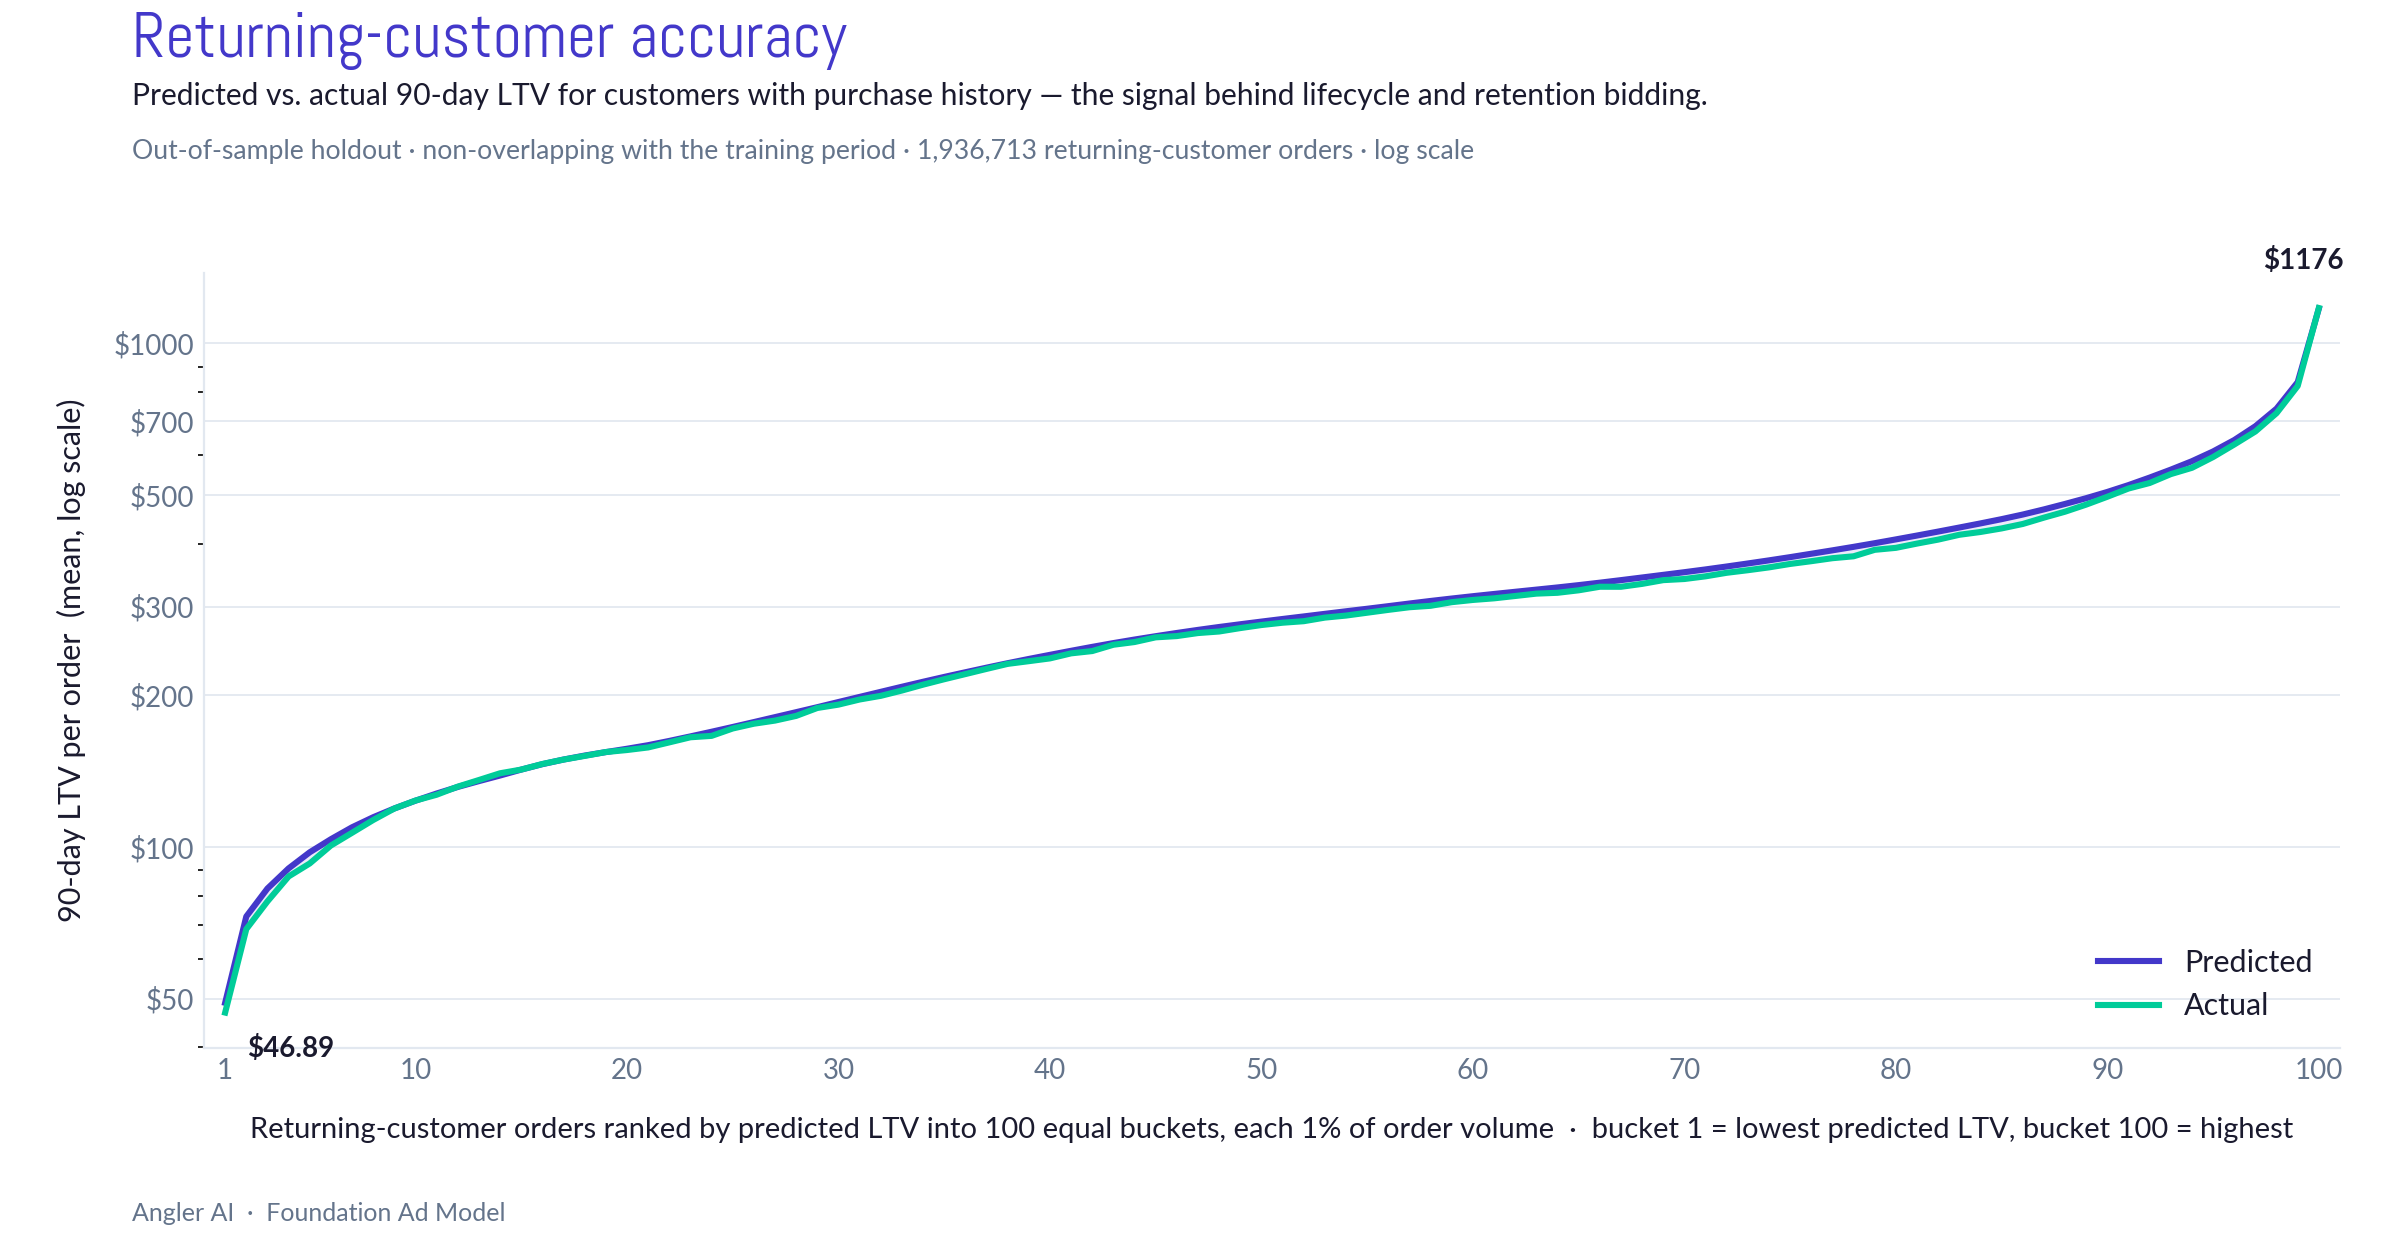
This is an easy problem, but easy does not mean low value. It is the signal underneath retention bidding, lifecycle segmentation, win-back thresholds and subscribe-and-save economics — and it is the one most brands can stand up first.
When done correctly, pLTV models are accurate enough to bid on — and that holds on the hard problems, not just the convenient one. Pre-purchase scoring separates value across two orders of magnitude before a visitor has ever bought. New-customer predictions land within half a percent in aggregate with no purchase history at all. Returning-customer predictions land within 10% in every single bucket.
No — it is not just for subscription businesses, though subscription brands (and brands offering both one-off purchases and subscribe-and-save) are a natural fit because repeat behaviour is built into the model. But if you are a DTC brand or an omni-retailer with a fair bit of repurchase activity in the first 90 days after acquiring a new customer, this is for you too. The question to ask is not “do I sell subscriptions” — it is “do a meaningful share of my new customers come back inside my prediction window?” If the answer is yes, there is LTV signal to bid on.
Value hacking overwrites the value field on your conversion event with a predicted number, so the platform’s generic value model — the same one every advertiser gets — chases it. Native pLTV support means the platform builds a model for your brand from your pLTV event stream, and the prediction travels in its own object. Current order value stays in the value field, so you can still calculate immediate ROAS and pLTV:CAC from the same event instead of choosing between them.
You pick one primary value equation per optimization, but that choice is a configuration rather than a permanent commitment. In practice, the exercise of choosing is the most useful part — it is the moment the CMO and CFO agree on a single definition of value and codify it in the model and the event payload. Most brands with meaningful returns land on net revenue or net margin; brands with wide cost variation across SKUs tend toward contribution margin.
Assuming a healthy Conversions API integration is already in place, the pLTV pipeline typically takes about two to three weeks to spin up. Events Manager gives you little visibility into whether your account is enabled for pLTV optimization, so verify status with your Meta account team rather than inferring it from the UI. You may also need your account whitelisted.
Start with the window your repurchase behaviour actually fills. If most repeat orders land inside 90 days, a 90-day window gives you a tighter, faster-validating signal. Longer windows suit considered-purchase categories and higher-ticket goods. A long window does not have to mean a stale model — ours still leans on the most recent data available so the forecast reflects current temporal trends.
Seal-the-envelope testing. Predictions are generated from the production environment, sealed, and then tracked against actuals as the cohort matures — the same setup you would run live, measured before any budget is committed to it. It is a materially stronger test than a backtest, because it exercises the real pipeline including latency, feature availability and identity resolution.
Possibly, but check three things first. Is it individual-level rather than cohort or RFM-based? Is it forward-looking from the moment of acquisition rather than a backward-looking description? And can it serve a prediction within minutes rather than in a nightly batch? Backward-looking LTV models are genuinely useful for reporting and cohort analysis; they are the wrong instrument for bidding. Also audit for feature leakage — historical features computed as-of today rather than as-of the prediction time are the most common failure mode.
Yes. Predictions can be produced by acquisition channel — online versus in-store — and repurchase can be modelled either within the same channel or across all channels combined. For most omni-retailers the combined view is the honest one, since a customer acquired online frequently repurchases in store and crediting only one side understates what the acquisition was worth.
Feature leakage is when a training feature contains information that would not have been available at the moment of prediction — for example, using a customer’s lifetime order count as it stands today when scoring their first order — which makes the model look excellent in evaluation and fail in production, where the future has not happened yet.
Angler builds a Foundation Ad Model for each brand — turning first-party data into the auction-ready signals platform AI needs, delivered through Predictive CAPI to Meta, Google and TikTok. If you want to see what your value optimization signal could look like, book a demo.
Read Part 1: Value Optimization Is a Sharp Stick — Getting Value and Profit Right on Meta and Google
Related: Cracking Predictive LTV-Based Bidding on Meta and Google Ads